
Connect to Big Query through dbConnect & translate dplyr to SQL
Introduction
Translating dplyr into SQL can save you a lot time. First of all, you can save time by not learning SQL or by learning only the basics. Secondly, I find SQL complicated. I can write simple queries, but performing the same data wrangling that I do with dplyr would require several painful hours of learning.
I could not find any documentation on how to translate dplyr code into SQL by using bigquery. The example provided in the official documentation uses “RSQLite::SQLite()” and did not work when applied to big query. Therefore, I thought I could write a post so that I can save you a bit of time!
Here, you can find the official documentation on how to connect to a database and translate dplyr code into SQL.
Index
In this post, you will learn:
- How to create a connection to big query by using dbConnect
- How to display the list of tables contained in a dataset
- How to query a specific table
- How to convert dplyr code into SQL
Packages
First of all, install and load the following packages:
library(tidyverse)
library(odbc)
library(bigrquery)
library(dbplyr)
Parameters
Before connecting to big query, you need to define the necessary parameters, namely:
- billing
- project
- dataset
Here is an example:
billing = "billing.name"
project = "project.name"
data_set = "data.set.name"
Create a connection
In the next step, you need to establish a connection with big query. To do so, use the “bigrquery::bigquery()” driver. A database driver is a computer program that implements a protocol for a database connection.
con = dbConnect(
    bigrquery::bigquery(),
    project = project,
    dataset = data_set,
    billing = billing
)
This will open a window in your browser and will allow you to authenticate and establish a connection with big query.
Tables
To see the list of tables contained in your connection, namely in your big query dataset, type the following code.
dbListTables(con)
Basically, what you are saying is: give me all the tables from the previously established connection.
Here is what it looks like:
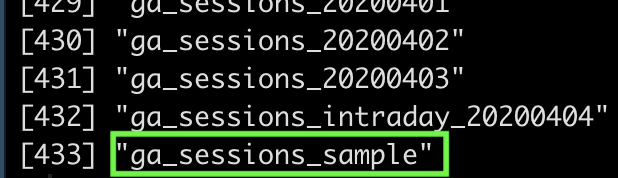
In our case, we will focus on the table named “ga_sessions_sample”.
Extract the data from the “ga_sessions_sample” table
The function “tbl” allows to query data from a particular table. The argument of this function is the name of the table:
big_query_tbl = con %>%
    tbl("ga_sessions_sample")
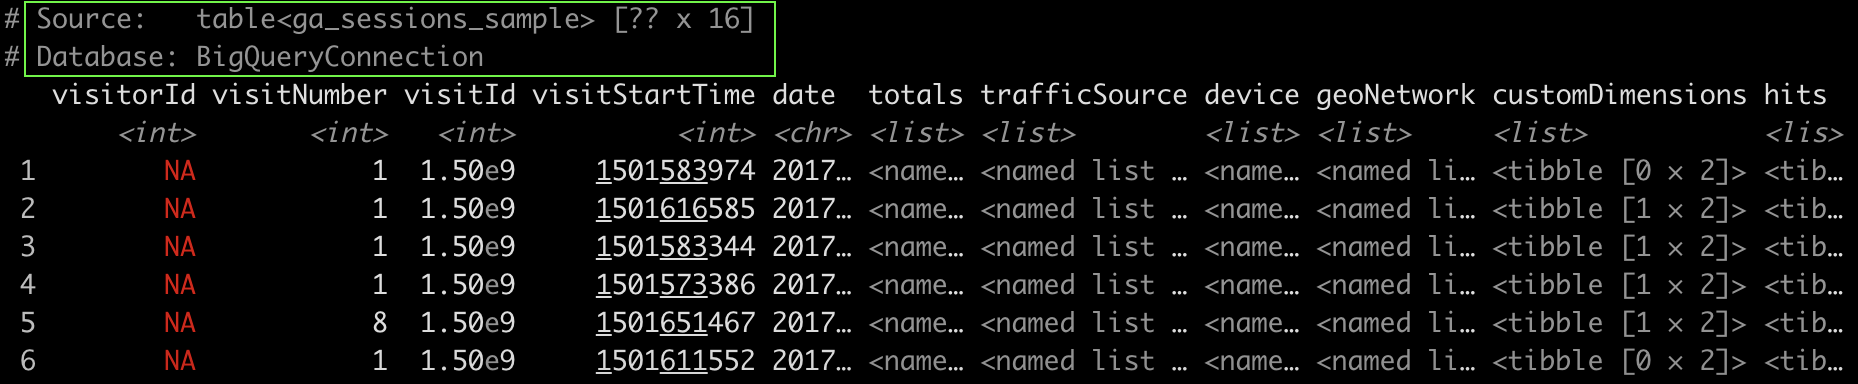
We are querying the table named “ga_sessions_sample” through the “con” connection and storing it in the “big_query_tbl” variable.
As you can see from the image below, the database is a “BigQueryConnection”.
Translate dplyr code into SQL
As an example, I want to create a SQL query where I count the frequencies of the variable “channelGrouping”. To do so, I write the code that I would usually write in dplyr and store it in the summary variable.
summary = big_query_tbl %>%
    group_by(channelGrouping) %>%
    summarize(count = n()) %>%
    ungroup() %>%
    arrange(desc(count))
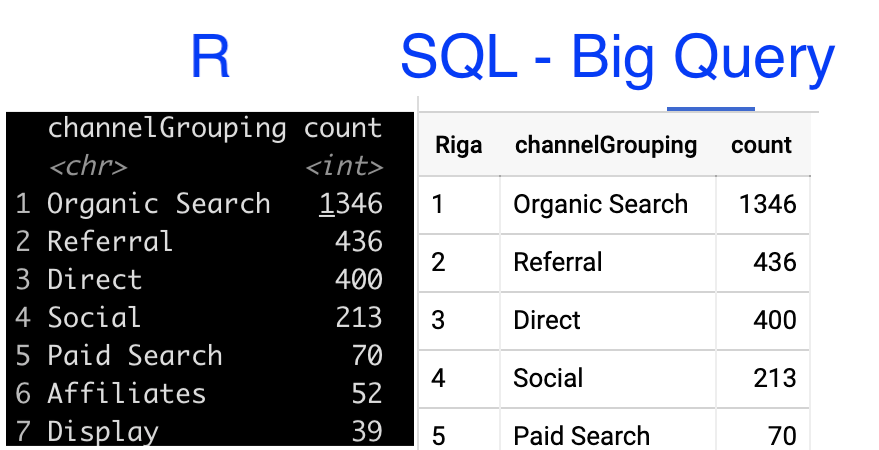
Here is the result:
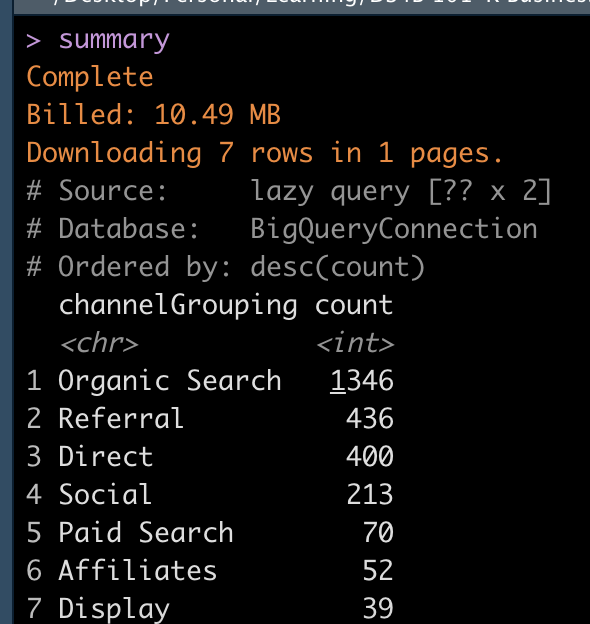
Finally, by applying the function show_query to the “summary” variable, you get your dplyr code translated in big query.
summary %>% show_query()
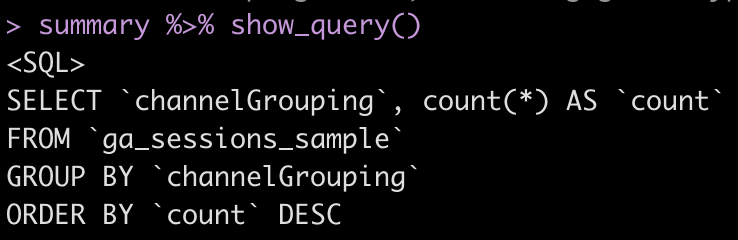
I went to the big query console and copy pasted the query created in R. I had to correct some punctuation details, but the query structure is the same and the result is the same as in R.
Query:
SELECT channelGrouping, count(*) AS count
FROM `project.dataset.ga_sessions_sample`
GROUP BY channelGrouping
ORDER BY count DESC
Result:
Conclusion
This is really cool, because you can use this query in several ways:
- Use the query directly in big query. This is faster as you are already in the platform
- Create cron jobs in big query, so that you don’t have to use a cloud solution and R as intermediaries
I hope this was useful :)
Feel free to share this post or connect with me on LinkedIn.
Happy Coding,
Arben